
Top States
 The Happy Confection Top StatesAug 2026
Top states where The Happy Confection is active based on indexed sales coverage.
Is this your Brand? Log in to Hoodie!
Aug 2026
Meet The Happy Confection: your local, queer-owned, woman-led, family-run dream team serving up joy, one bite at a time! We’re here to empower the modern cannaconsumer with out-of-the-box blends, unique doses, and bold flavors. Our pastry chef-crafted infused gems aren’t just d...
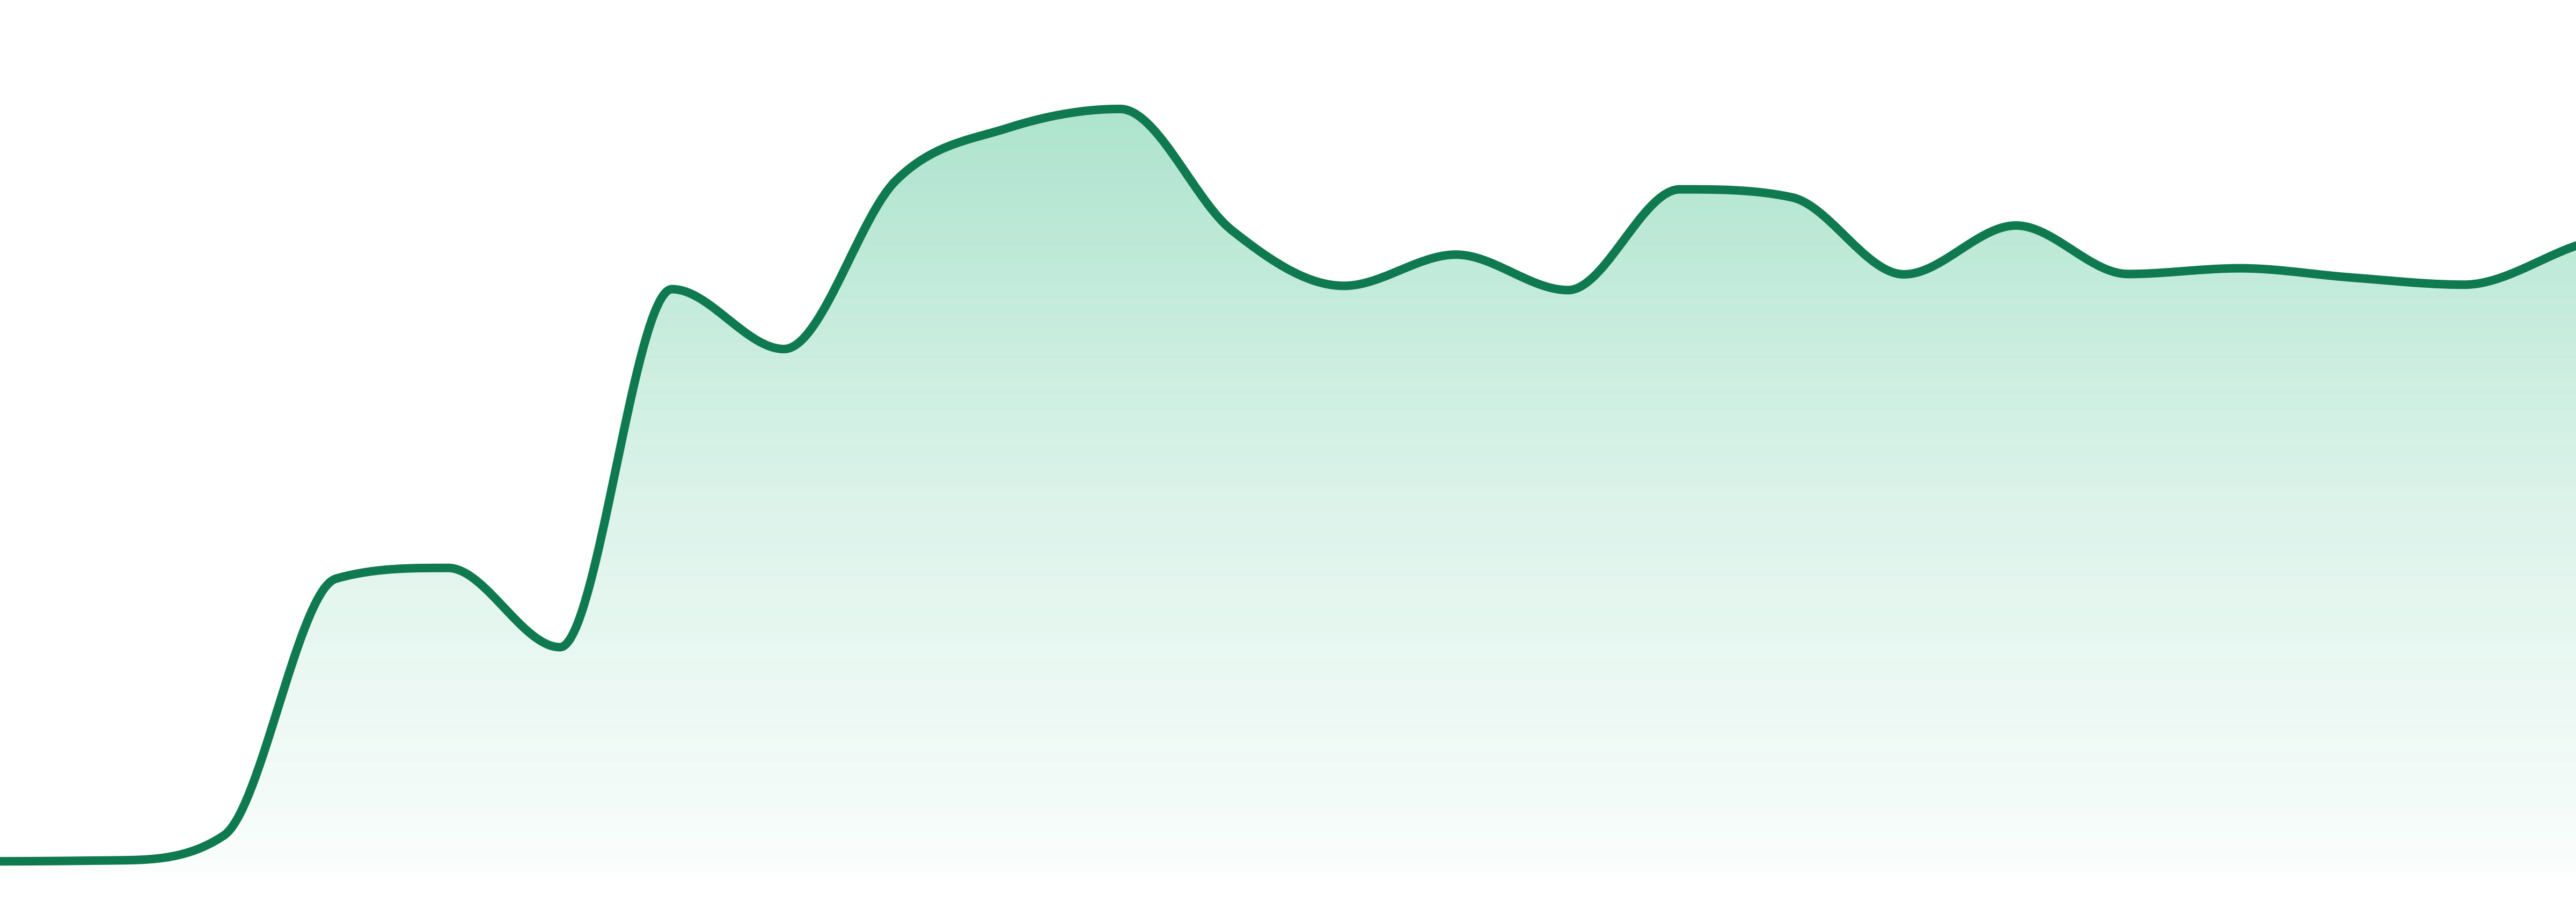
THE HAPPY CONFECTION boasts an impressive 55.3% YoY growth in the premium tier, despite a recent 10.8% dip over the last three months. This upward trajectory highlights the brand's resilience in a competitive landscape.
Categories
Top States
The Happy Confection Top StatesAug 2026Top states where The Happy Confection is active based on indexed sales coverage.
Trend View
Market Insights SnapshotAug 202624-Month Trend

Average Price
$33.06
YoY Sales Trend
2.4%
2Y Sales Trend
5697.1%
Edibles dominate with a remarkable 100% share, marking the fastest-growing category at +55.3% YoY. This concentration showcases the brand's strong foothold in the edible segment.
| Category | Sales Share | Avg Price | YoY |
|---|---|---|---|
Unlock The Full Table
Log in to unlock the full category breakout table and image export actions for this brand.
Trend View
Market Insights SnapshotAug 202624-Month Trend
Average Price
$33.06
YoY Sales Trend
2.4%
2Y Sales Trend
5697.1%
Category Breakout
| Category | Sales Share | Avg Price | YoY |
|---|---|---|---|
| Edibles | 100.0% | $33.06 | 2.4% |
State Rank Table
| State | Edibles |
|---|---|
| Connecticut | 6 |
THE HAPPY CONFECTION is solely concentrated in Connecticut, representing 100% of its sales in the state. This geographic focus emphasizes its strong local market presence.
| State | Edibles |
|---|---|
Unlock The Full Table
Log in to unlock the full state rank table and compare every category row for this brand.
Market Position
Competitive LandscapeAug 2026Ranked #6 in Edibles, THE HAPPY CONFECTION trails behind SOUNDVIEW (#1) and ENCORE EDIBLES (#2) while improving from #7 to #6 over the past year. The competitive landscape remains tight as it inches closer to its peers.
SKU View
Top Selling ProductsAug 2026Top products for Aug 2026 with sales and momentum indicators.
| Product | Category | MoM |
|---|---|---|
#2  | Edibles | 4.7% |
#4  | Edibles | 6.3% |
#6  | Edibles | 41.8% |
#8  | Edibles | 176.6% |
#10  | Edibles | 15.8% |
Unlock The Full Table
Log in to unlock the full top selling products table and export the share image for this section.
Benchmarking
Peer brands benchmarked against The Happy Confection using competitive landscape rank coverage, proximity, and momentum.


