


Top States
 Chronic Health Top StatesSep 2026
Top states where Chronic Health is active based on indexed sales coverage.
Is this your Brand? Log in to Hoodie!
Sep 2026
Chronic Health provides our customers with the markets leading quality CBD products. From our homemade salves to pure oils, our products are available in a variety of strengths with your choice of full-spectrum or CBD isolate. We also assist in your proprietary applications by pr...
Rank slipped from #5 to #7 in Arizona—mid-tier positioning. Sales trend up 20.3% over the last three months, contrasting with a 5.6% decline YoY. This highlights both competitive pressures and potential for recovery.
Categories
Top States
Chronic Health Top StatesSep 2026Top states where Chronic Health is active based on indexed sales coverage.
Trend View
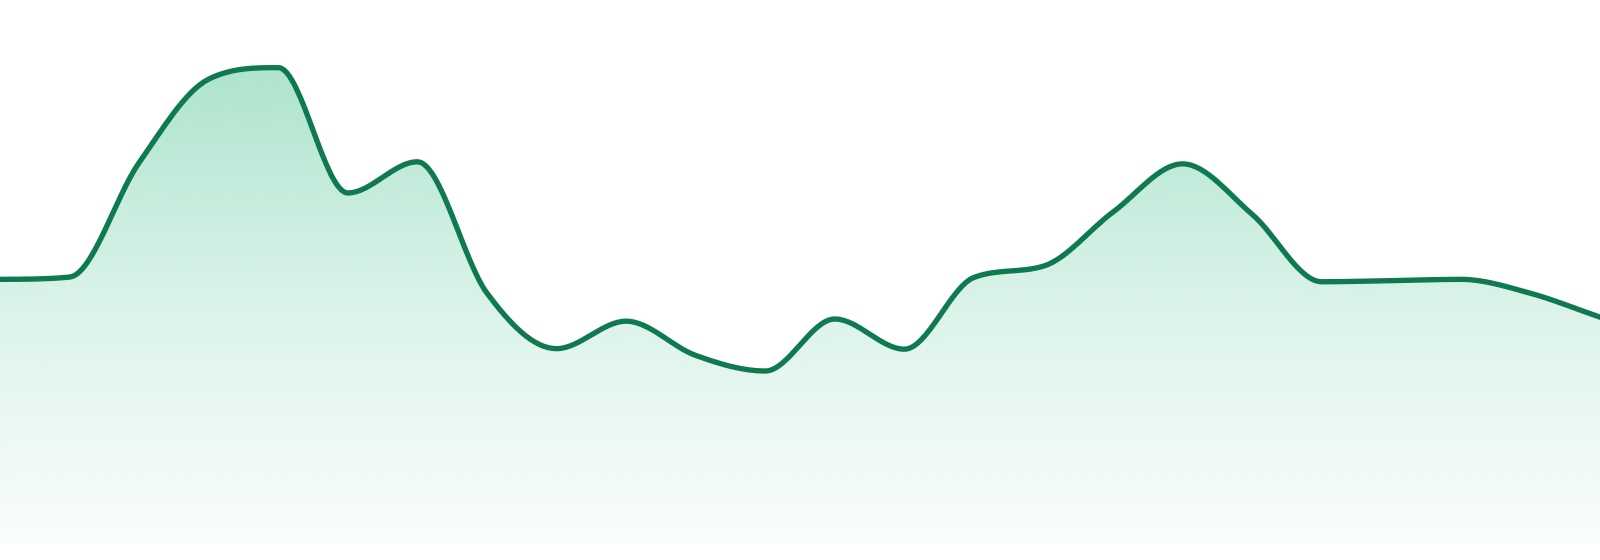
Market Insights SnapshotSep 202624-Month Trend

Average Price
$19.31
YoY Sales Trend
31.1%
2Y Sales Trend
11.8%
Concentrates lead with a remarkable 70.8% YoY growth, while Oral products decline 23.3%. Topicals maintain the largest share at 53.3%, though they also saw an 8% drop YoY.
| Category | Sales Share | Avg Price | YoY |
|---|---|---|---|
| Oral | 24.2% | $12.56 | 23.9% |
Unlock The Full Table
Log in to unlock the full category breakout table and image export actions for this brand.
Trend View
Market Insights SnapshotSep 202624-Month Trend
Average Price
$19.31
YoY Sales Trend
31.1%
2Y Sales Trend
11.8%
Category Breakout
| Category | Sales Share | Avg Price | YoY |
|---|---|---|---|
| Topicals | 54.3% | $21.73 | 38.4% |
| Oral | 24.2% | $12.56 | 23.9% |
| Concentrates | 21.6% | $28.12 | 332.1% |
State Rank Table
| State | Topicals | Oral | Concentrates | Pre-Roll |
|---|---|---|---|---|
| Arizona | 7 | 7 | ⊖ | ⊖ |
CHRONIC HEALTH is solely present in Arizona, capturing 100% of its sales in this state, showcasing a high geographic concentration.
| State | Topicals | Oral | Concentrates | Pre-Roll |
|---|---|---|---|---|
Unlock The Full Table
Log in to unlock the full state rank table and compare every category row for this brand.
Market Position
Competitive LandscapeSep 2026Competitive summary unavailable.
SKU View
Top Selling ProductsSep 2026Top products for Sep 2026 with sales and momentum indicators.
| Product | Category | MoM |
|---|---|---|
#2  | Topicals | 28.4% |
#4  | Topicals | 6.5% |
#6  | Topicals | 34.2% |
Unlock The Full Table
Log in to unlock the full top selling products table and export the share image for this section.
Benchmarking
Peer brands benchmarked against Chronic Health using competitive landscape rank coverage, proximity, and momentum.


