


Top States
 Zen Blend Farms Top StatesOct 2026
Top states where Zen Blend Farms is active based on indexed sales coverage.
Is this your Brand? Log in to Hoodie!
Oct 2026
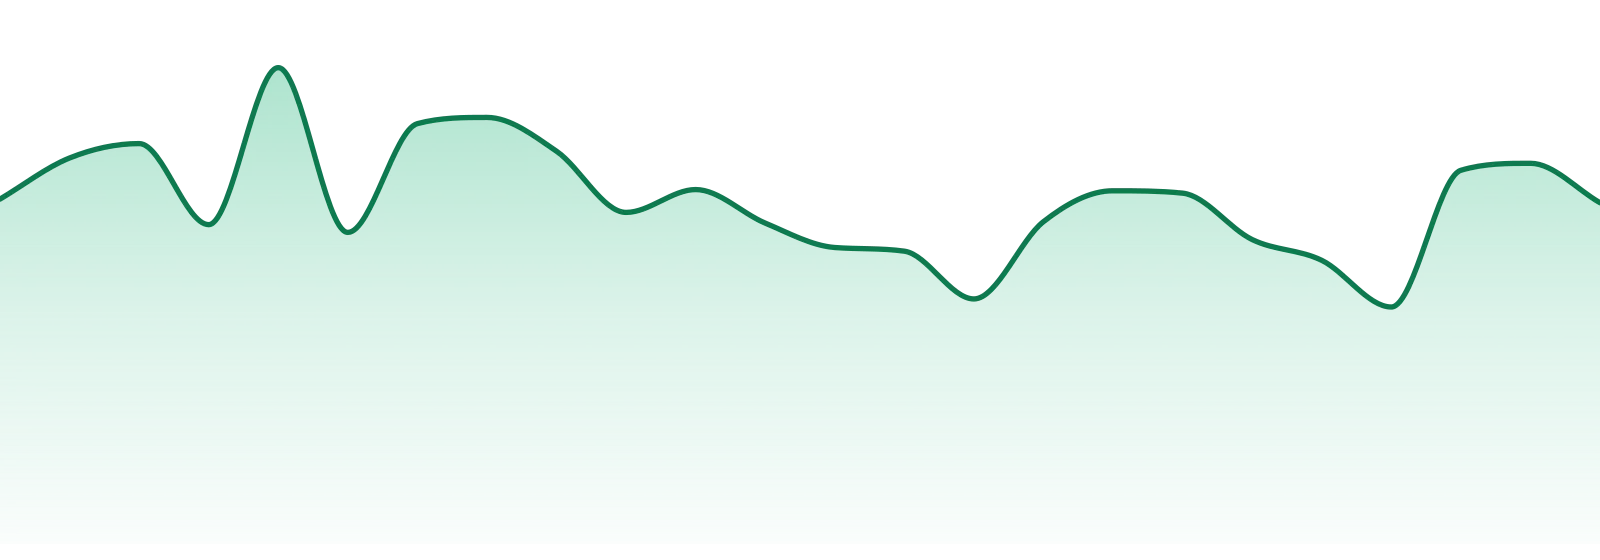
YoY sales dropped 12.5% for ZEN BLEND FARMS, while a surprising 36.5% surge over the last three months indicates potential for recovery. Mid-tier positioning may help attract consumers back as the brand navigates this challenging landscape.
Categories
Top States
Zen Blend Farms Top StatesOct 2026Top states where Zen Blend Farms is active based on indexed sales coverage.
Trend View
Market Insights SnapshotOct 202624-Month Trend

Average Price
$21.89
YoY Sales Trend
6.3%
2Y Sales Trend
15.0%
Flower dominates at 35.4% of total sales, showing a 7.4% increase YoY. In contrast, Edibles are struggling with a 24.0% decline, while Oral products are surging at 201.7% YoY, highlighting shifting consumer preferences.
| Category | Sales Share | Avg Price | YoY |
|---|---|---|---|
| Pre-Rolls | 27.0% | $17.88 | 1.5% |
| Vapes | 18.3% | $29.25 | 352.6% |
Unlock The Full Table
Log in to unlock the full category breakout table and image export actions for this brand.
Trend View
Market Insights SnapshotOct 202624-Month Trend
Average Price
$21.89
YoY Sales Trend
6.3%
2Y Sales Trend
15.0%
Category Breakout
| Category | Sales Share | Avg Price | YoY |
|---|---|---|---|
| Flower | 29.2% | $30.45 | 7.0% |
| Pre-Rolls | 27.0% | $17.88 | 1.5% |
| Edibles | 22.2% | $15.98 | 23.3% |
| Vapes | 18.3% | $29.25 | 352.6% |
| Oral | 3.2% | $31.15 | 31.8% |
State Rank Table
| State | Flower | Pre-Roll | Edibles | Vapor Pens | Oral | Concentrates |
|---|---|---|---|---|---|---|
| Rhode Island | 28 | 15 | 11 | 19 | 8 | 27 |
ZEN BLEND FARMS holds a concentrated presence in Rhode Island, accounting for 100% of its sales. The brand is currently active in just one state, emphasizing its regional focus.
| State | Flower | Pre-Roll | Edibles | Vapor Pens | Oral | Concentrates |
|---|---|---|---|---|---|---|
Unlock The Full Table
Log in to unlock the full state rank table and compare every category row for this brand.
Market Position
Competitive LandscapeOct 2026Competitive summary unavailable.
SKU View
Top Selling ProductsOct 2026Top products for Oct 2026 with sales and momentum indicators.
| Product | Category | MoM |
|---|---|---|
#2  | Edibles | 143.5% |
#4  | Edibles | 13.1% |
#6  | Edibles | 10.6% |
Unlock The Full Table
Log in to unlock the full top selling products table and export the share image for this section.
Benchmarking
Peer brands benchmarked against Zen Blend Farms using competitive landscape rank coverage, proximity, and momentum.


