


Top States
Arctic Extracts Top StatesOct 2026
Top states where Arctic Extracts is active based on indexed sales coverage.
Is this your Brand? Log in to Hoodie!
Oct 2026
YoY growth skyrocketed to +613.3% for ARCTIC EXTRACTS in the mid-tier segment, with a 37.7% increase over the last three months. This brand's momentum reflects a significant shift in demand and market positioning within the <250K tier.
Categories
Top States
Top states where Arctic Extracts is active based on indexed sales coverage.
Trend View
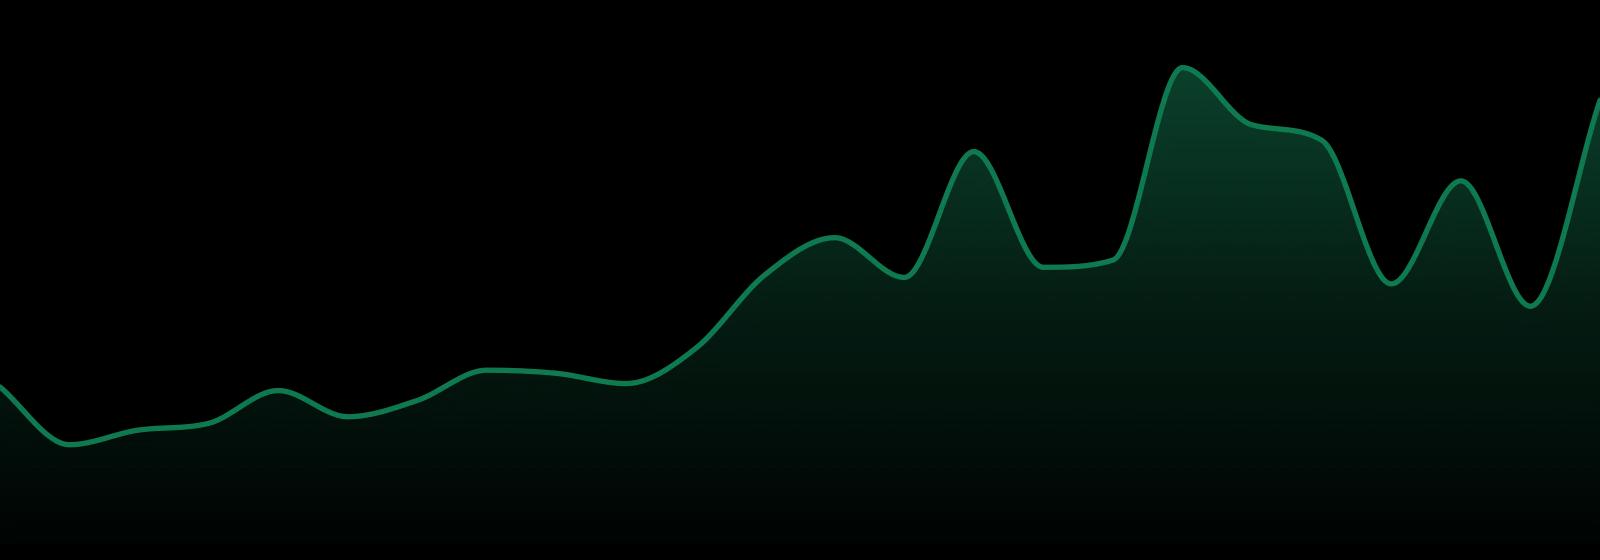
24-Month Trend
Average Price
$15.53
YoY Sales Trend
64.7%
2Y Sales Trend
175.8%
Vapes dominate growth at +4528.2% YoY, while Concentrates hold the largest share at 51.5%, growing +296.9% YoY. This highlights a major shift in consumer preferences towards vape products.
| Category | Sales Share | Avg Price | YoY |
|---|---|---|---|
| Concentrates | 48.7% | $16.65 | 10.1% |
Unlock The Full Table
Log in to unlock the full category breakout table and image export actions for this brand.
Trend View
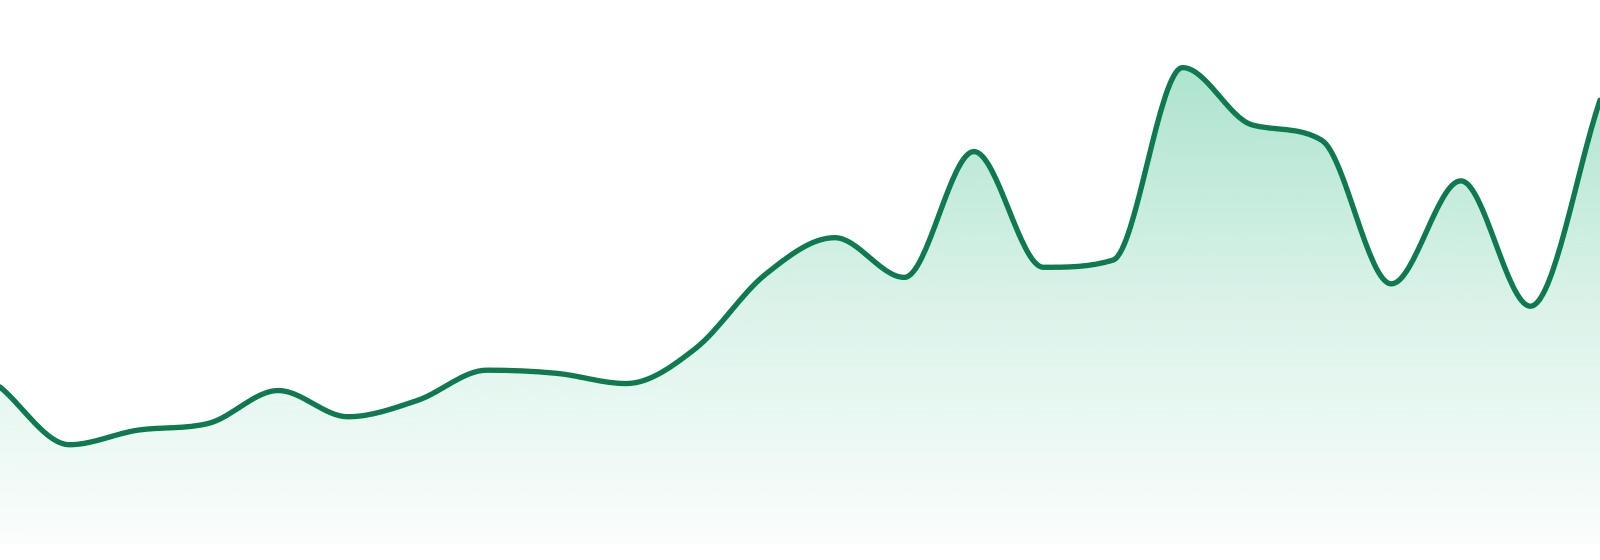
24-Month Trend
Average Price
$15.53
YoY Sales Trend
64.7%
2Y Sales Trend
175.8%
Category Breakout
| Category | Sales Share | Avg Price | YoY |
|---|---|---|---|
| Vapes | 49.4% | $14.87 | 663.4% |
| Concentrates | 48.7% | $16.65 | 10.1% |
| Pre-Rolls | 1.8% | $9.86 | N/A |
State Rank Table
| State | Vapor Pens | Concentrates | Pre-Roll |
|---|---|---|---|
| Oklahoma | 15 | 2 | ⊖ |
Oklahoma is the sole market for ARCTIC EXTRACTS, commanding 100% of its sales. This high concentration underscores the brand's niche presence in a single state.
| State | Vapor Pens | Concentrates | Pre-Roll |
|---|---|---|---|
Unlock The Full Table
Log in to unlock the full state rank table and compare every category row for this brand.
Market Position
ARCTIC EXTRACTS ranks #4 in the Concentrates category, improving from #28 within a year. Competing closely with TRIBE (#1), SUNDAY EXTRACTS (#2), and DIME INDUSTRIES (#3), this brand has gained significant ground in the competitive landscape.
SKU View
Top products for Oct 2026 with sales and momentum indicators.
| Product | Category | MoM |
|---|---|---|
#2  | Vapes | 281.9% |
#4 | Vapes | 35.4% |
#6  | Vapes | 258.7% |
#8 | Vapes | 439.4% |
#10 | Vapes | 609.9% |
Unlock The Full Table
Log in to unlock the full top selling products table and export the share image for this section.
Benchmarking
Peer brands benchmarked against Arctic Extracts using competitive landscape rank coverage, proximity, and momentum.


