


Top States
 Back Home Cannabis Co Top StatesAug 2026
Top states where Back Home Cannabis Co is active based on indexed sales coverage.
Is this your Brand? Log in to Hoodie!
Aug 2026
We are a 75 acre organic farm located in the heart of the Hudson Valley, in the town of High Falls. We grow diverse vegetables, herbs, flowers, mushrooms, and cannabis. The soil is the heart of our farm and is what we are in most of awe of. It is rockless, holds moisture, and is...
Rank slipped from #13 to #14 in New York—premium tier status. Sales down 14.8% over the last three months, indicating competitive pressure.
Categories
Top States
Back Home Cannabis Co Top StatesAug 2026Top states where Back Home Cannabis Co is active based on indexed sales coverage.
Trend View
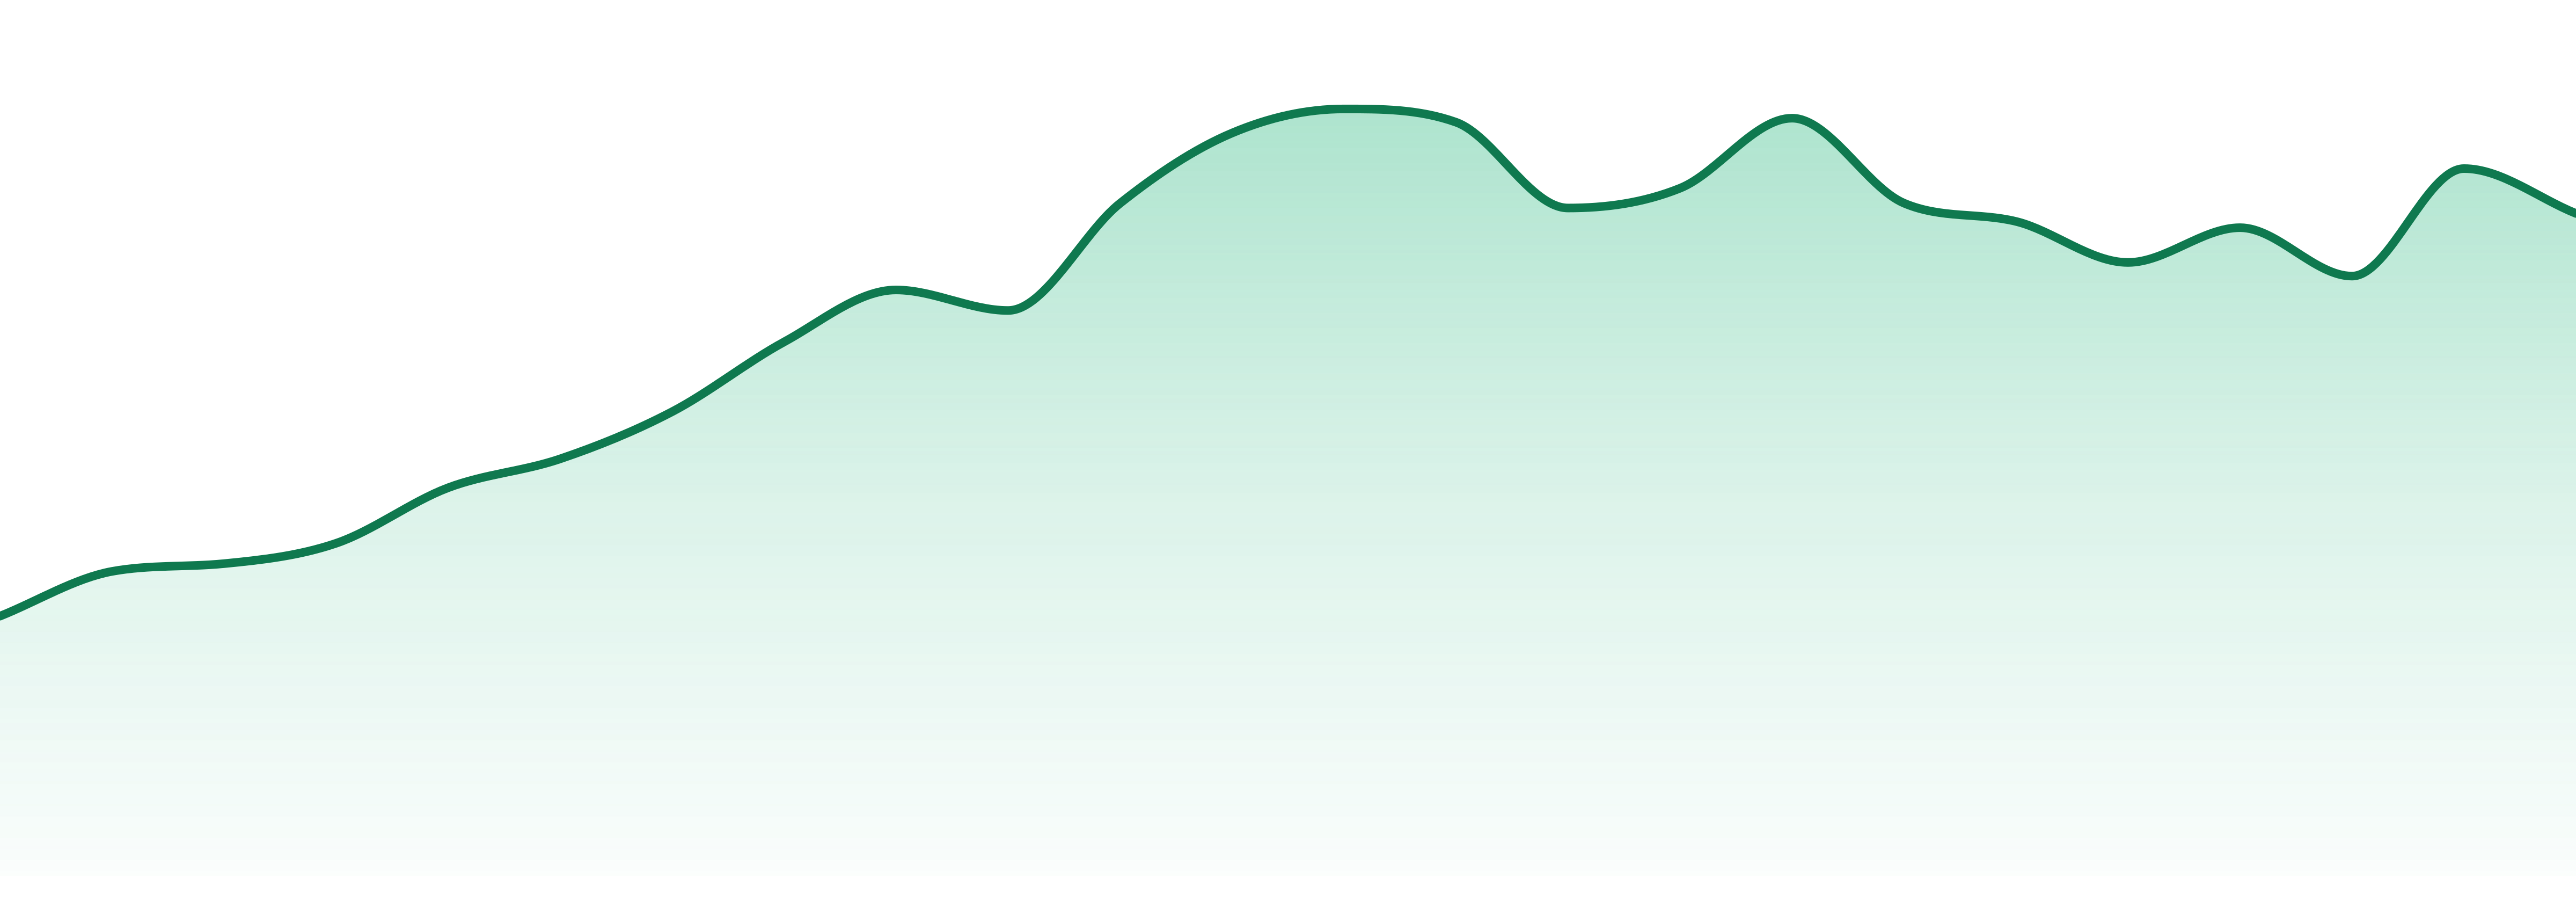
Market Insights SnapshotAug 202624-Month Trend

Average Price
$34.73
YoY Sales Trend
10.8%
2Y Sales Trend
96.8%
Flower dominates with 72.3% of sales, growing only 0.3% YoY. Pre-Rolls are the fastest-growing segment, up 14.8% YoY, capturing 27.1% of the market.
| Category | Sales Share | Avg Price | YoY |
|---|---|---|---|
| Pre-Rolls | 31.9% | $29.8 | 5.4% |
Unlock The Full Table
Log in to unlock the full category breakout table and image export actions for this brand.
Trend View
Market Insights SnapshotAug 202624-Month Trend
Average Price
$34.73
YoY Sales Trend
10.8%
2Y Sales Trend
96.8%
Category Breakout
| Category | Sales Share | Avg Price | YoY |
|---|---|---|---|
| Flower | 67.2% | $38.07 | 16.5% |
| Pre-Rolls | 31.9% | $29.8 | 5.4% |
State Rank Table
| State | Flower | Pre-Roll | Edibles |
|---|---|---|---|
| New York | 14 | 19 | ⊖ |
BACK HOME CANNABIS CO's footprint is concentrated in New York, accounting for 100% of sales. Currently active in a single state.
| State | Flower | Pre-Roll | Edibles |
|---|---|---|---|
Unlock The Full Table
Log in to unlock the full state rank table and compare every category row for this brand.
Market Position
Competitive LandscapeAug 2026Competitive summary unavailable.
SKU View
Top Selling ProductsAug 2026Top products for Aug 2026 with sales and momentum indicators.
| Product | Category | MoM |
|---|---|---|
#2  | Flower | 1.9% |
#4  | Flower | 13.9% |
#6  | Flower | 19.2% |
#8  | Flower | 40.6% |
#10  | Edibles | 27.6% |
Unlock The Full Table
Log in to unlock the full top selling products table and export the share image for this section.
Benchmarking
Peer brands benchmarked against Back Home Cannabis Co using competitive landscape rank coverage, proximity, and momentum.


