

Top States
 Mitten Canna Co Top StatesSep 2026
Top states where Mitten Canna Co is active based on indexed sales coverage.
Is this your Brand? Log in to Hoodie!
Sep 2026
MITTEN CANNA CO's sales fell 19.4% YoY, driving a rank decline from #43 to #54 in Michigan. Despite this, a 31.1% increase over the past three months highlights a potential shift in strategy that could stabilize future performance.
Categories
Top States
Mitten Canna Co Top StatesSep 2026Top states where Mitten Canna Co is active based on indexed sales coverage.
Trend View
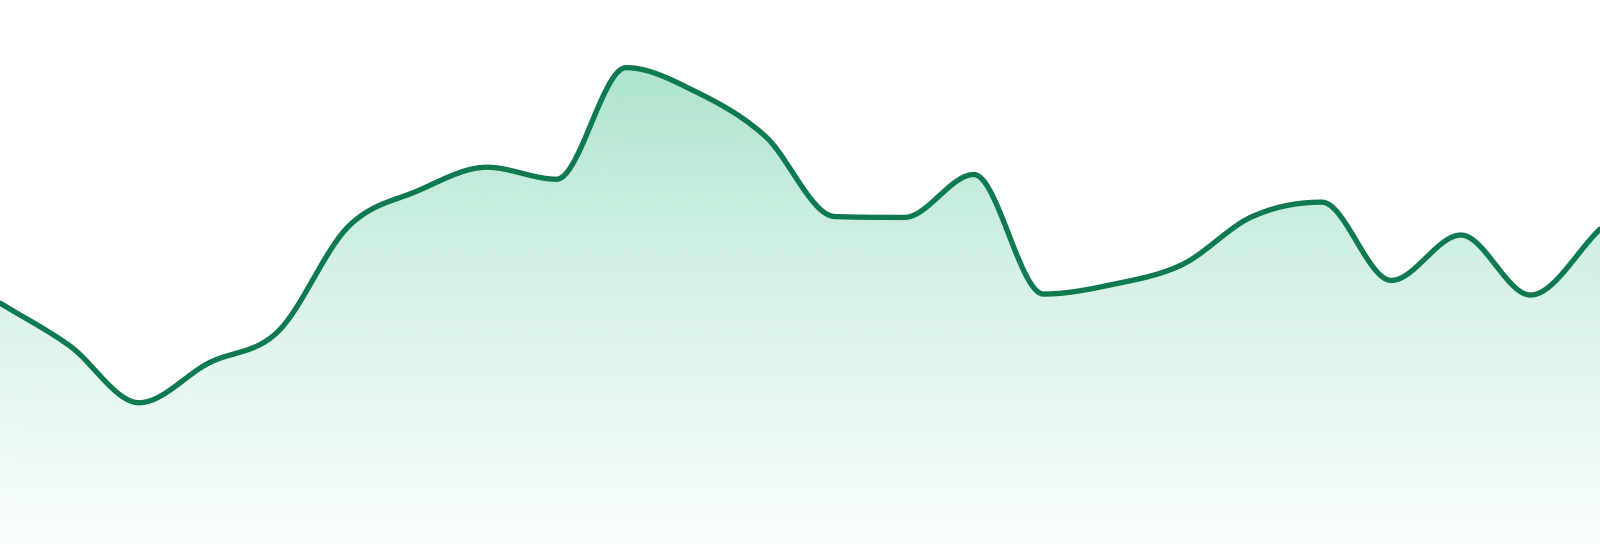
Market Insights SnapshotSep 202624-Month Trend

Average Price
$30.52
YoY Sales Trend
22.8%
2Y Sales Trend
108.0%
Flower dominates at 98.9% of total sales but is down 18.4% YoY; Pre-Rolls, however, are the fastest-growing segment, up 5.7% YoY, showcasing a shift in consumer preferences.
| Category | Sales Share | Avg Price | YoY |
|---|---|---|---|
| Pre-Rolls | 4.8% | $11.07 | 31115.3% |
Unlock The Full Table
Log in to unlock the full category breakout table and image export actions for this brand.
Trend View
Market Insights SnapshotSep 202624-Month Trend
Average Price
$30.52
YoY Sales Trend
22.8%
2Y Sales Trend
108.0%
Category Breakout
| Category | Sales Share | Avg Price | YoY |
|---|---|---|---|
| Flower | 95.2% | $33.67 | 26.9% |
| Pre-Rolls | 4.8% | $11.07 | 31115.3% |
Market Position
Competitive LandscapeSep 2026Competitive summary unavailable.
SKU View
Top Selling ProductsSep 2026Top products for Sep 2026 with sales and momentum indicators.
| Product | Category | MoM |
|---|---|---|
#2  | Flower | 4240.4% |
#4  | Flower | 242.3% |
#6  | Flower | 962.2% |
#8 | Flower | 494.4% |
Unlock The Full Table
Log in to unlock the full top selling products table and export the share image for this section.
Benchmarking
Peer brands benchmarked against Mitten Canna Co using competitive landscape rank coverage, proximity, and momentum.


