
Top States
 Swifts Top StatesSep 2026
Top states where Swifts is active based on indexed sales coverage.
Is this your Brand? Log in to Hoodie!
Sep 2026
Swifts Edibles has precise and creative method for consistently dosed handcrafted edibles and terpene packed single strain smokables. Forged by a talented group of determined and daring entrepreneurs, Swifts Edibles has grown to include precisely infused gummies, mints, and hone...
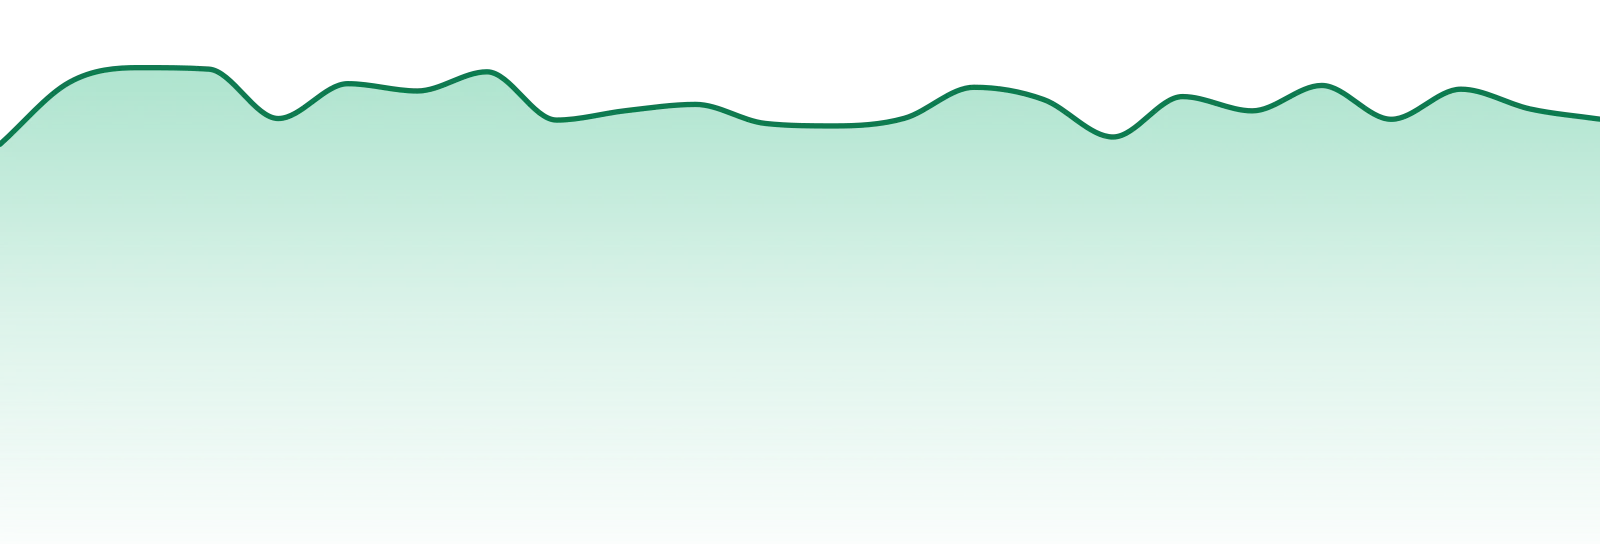
SWIFTS is gaining traction with a 6.3% increase over the last three months. Despite a 1.9% decline YoY, monthly sales surged 11.4%, showcasing a potential turnaround in performance. Mid-tier pricing remains consistent.
Categories
Top States
Swifts Top StatesSep 2026Top states where Swifts is active based on indexed sales coverage.
Trend View
Market Insights SnapshotSep 202624-Month Trend

Average Price
$16.04
YoY Sales Trend
1.0%
2Y Sales Trend
16.5%
Edibles dominate with a massive 98.3% share, though the category is down 2.5% YoY. This concentration underscores the brand's focus, even as the segment shows signs of slowing.
| Category | Sales Share | Avg Price | YoY |
|---|---|---|---|
Unlock The Full Table
Log in to unlock the full category breakout table and image export actions for this brand.
Trend View
Market Insights SnapshotSep 202624-Month Trend
Average Price
$16.04
YoY Sales Trend
1.0%
2Y Sales Trend
16.5%
Category Breakout
| Category | Sales Share | Avg Price | YoY |
|---|---|---|---|
| Edibles | 100.0% | $16.06 | 1.1% |
State Rank Table
| State | Edibles | Oral | Other | Pre-Roll | Vapor Pens |
|---|---|---|---|---|---|
| Washington | 8 | 24 | 24 | ⊖ | ⊖ |
SWIFTS commands a stronghold in Washington, accounting for 100% of its sales. Geographic concentration is high, with the brand currently active in only one state.
| State | Edibles | Oral | Other | Pre-Roll | Vapor Pens |
|---|---|---|---|---|---|
Unlock The Full Table
Log in to unlock the full state rank table and compare every category row for this brand.
Market Position
Competitive LandscapeSep 2026Competitive summary unavailable.
SKU View
Top Selling ProductsSep 2026Top products for Sep 2026 with sales and momentum indicators.
| Product | Category | MoM |
|---|---|---|
#2  | Edibles | 1.9% |
#4  | Edibles | 1.8% |
#6  | Edibles | 14.2% |
#8  | Edibles | 12.4% |
#10  | Edibles | 58.3% |
Unlock The Full Table
Log in to unlock the full top selling products table and export the share image for this section.
Benchmarking
Peer brands benchmarked against Swifts using competitive landscape rank coverage, proximity, and momentum.


