
Top States
 Tye Dye Gummies Top StatesSep 2026
Top states where Tye Dye Gummies is active based on indexed sales coverage.
Is this your Brand? Log in to Hoodie!
Sep 2026
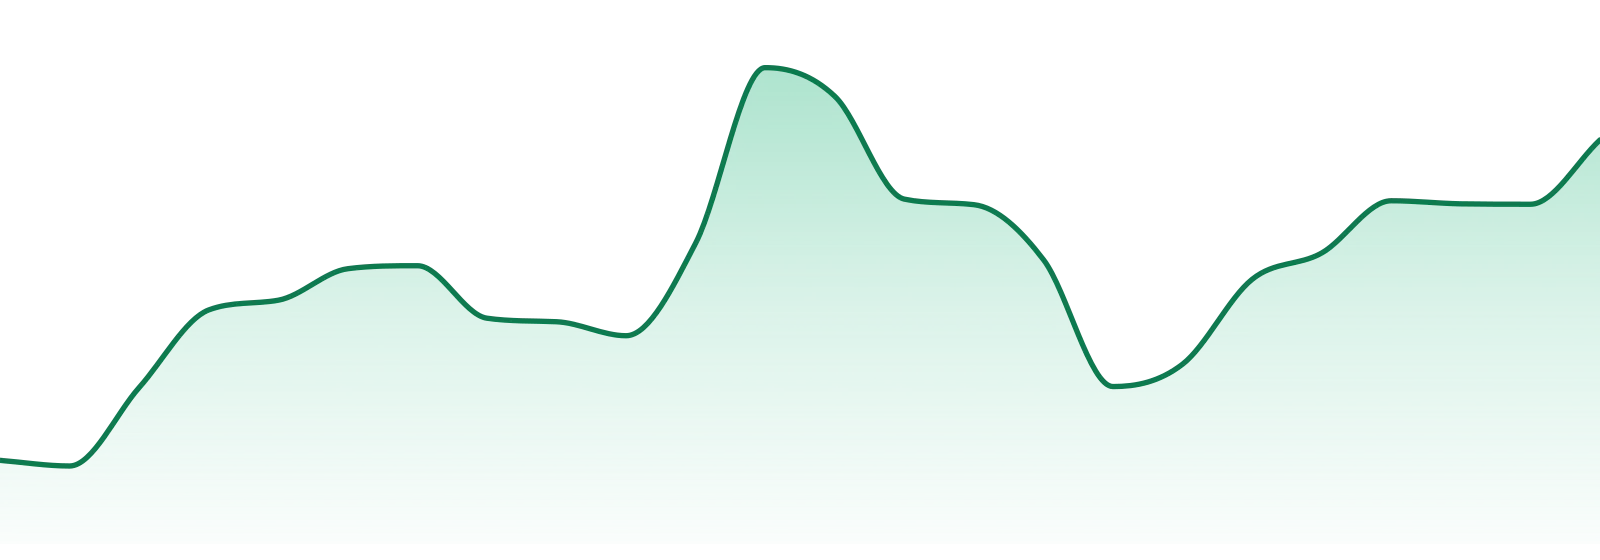
Despite a 6.8% dip in YoY sales, TYE DYE GUMMIES shows a surprising 65.8% surge over the last three months, highlighting resilience in the mid-tier market. Unit sales are down significantly, indicating a critical moment for adjustment.
Categories
Top States
Tye Dye Gummies Top StatesSep 2026Top states where Tye Dye Gummies is active based on indexed sales coverage.
Trend View
Market Insights SnapshotSep 202624-Month Trend

Average Price
$13.74
YoY Sales Trend
15.2%
2Y Sales Trend
355.1%
Edibles dominate at 100% of sales, but the category is experiencing a decline of 6.8% YoY, the slowest among cannabis products. This concentration in Edibles showcases a challenging landscape for growth.
| Category | Sales Share | Avg Price | YoY |
|---|---|---|---|
Unlock The Full Table
Log in to unlock the full category breakout table and image export actions for this brand.
Trend View
Market Insights SnapshotSep 202624-Month Trend
Average Price
$13.74
YoY Sales Trend
15.2%
2Y Sales Trend
355.1%
Category Breakout
| Category | Sales Share | Avg Price | YoY |
|---|---|---|---|
| Edibles | 100.0% | $13.74 | 15.2% |
State Rank Table
| State | Edibles |
|---|---|
| Montana | 6 |
Montana leads with 100% of TYE DYE GUMMIES' sales, showcasing a highly concentrated geographic presence. Currently, the brand operates solely within this state.
| State | Edibles |
|---|---|
Unlock The Full Table
Log in to unlock the full state rank table and compare every category row for this brand.
Market Position
Competitive LandscapeSep 2026Competitive summary unavailable.
SKU View
Top Selling ProductsSep 2026Top products for Sep 2026 with sales and momentum indicators.
| Product | Category | MoM |
|---|---|---|
#2  | Edibles | 41.8% |
#4  | Edibles | 33.2% |
#6  | Edibles | 15.7% |
Unlock The Full Table
Log in to unlock the full top selling products table and export the share image for this section.
Benchmarking
Peer brands benchmarked against Tye Dye Gummies using competitive landscape rank coverage, proximity, and momentum.


