


Top States
Canadian Cannabis Top StatesOct 2026
Top states where Canadian Cannabis is active based on indexed sales coverage.
Is this your Brand? Log in to Hoodie!
Oct 2026
Canadian Cannabis cannabis brand overview - snapshot Nov 4, 2026.
Canadian Cannabis generated approximately $1,019,523 in the latest period and is classified as a premium-tier brand. It is a niche or emerging brand. Average global price is $26.
Canadian Cannabis has $1-2.5M in monthly sales with N/A units sold globally.
Categories
Top States
Top states where Canadian Cannabis is active based on indexed sales coverage.
Trend View
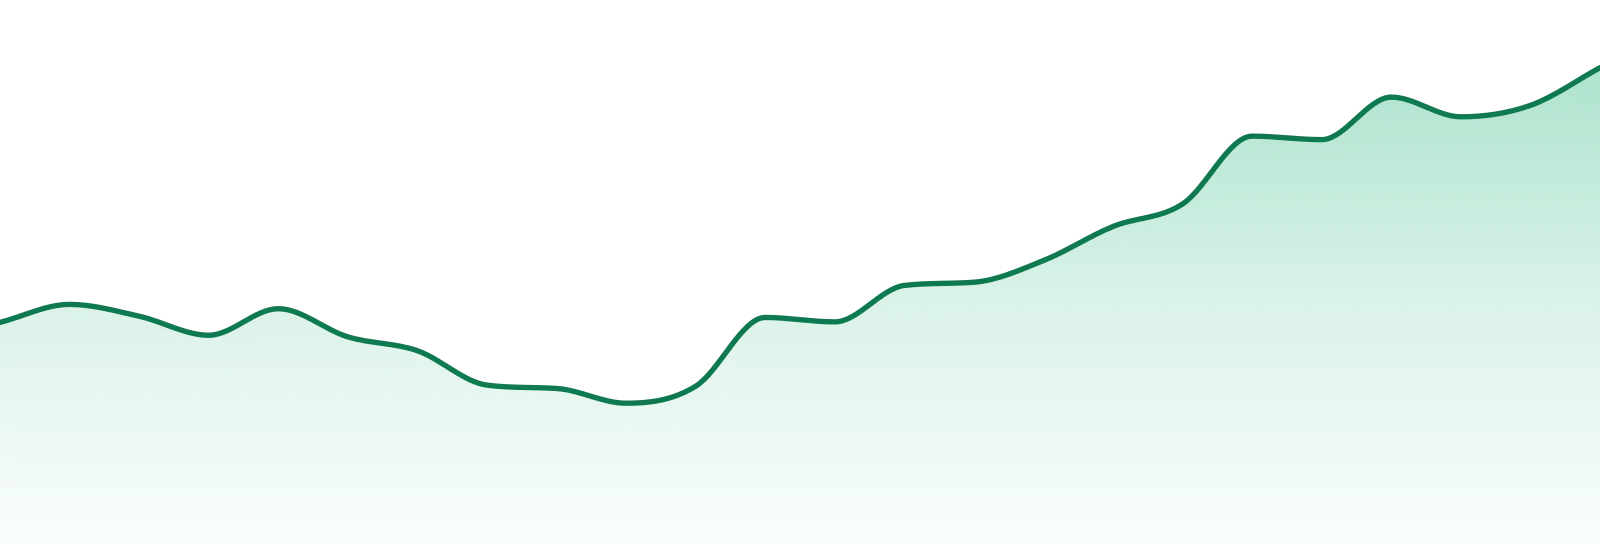
24-Month Trend

Average Price
$26.35
YoY Sales Trend
109.9%
2Y Sales Trend
110.9%
The brand's strongest categories are Flower (approx 56% of brand sales) and Pre-Rolls.
| Category | Sales Share | Avg Price | YoY |
|---|---|---|---|
| Pre-Rolls | 30.5% | $14.64 | 160.8% |
| Concentrates | 4.1% | $24 | 1242.7% |
Unlock The Full Table
Log in to unlock the full category breakout table and image export actions for this brand.
Trend View
24-Month Trend
Average Price
$26.35
YoY Sales Trend
109.9%
2Y Sales Trend
110.9%
Category Breakout
| Category | Sales Share | Avg Price | YoY |
|---|---|---|---|
| Flower | 56.2% | $46.76 | 74.5% |
| Pre-Rolls | 30.5% | $14.64 | 160.8% |
| Vapes | 9.1% | $26.37 | 167.6% |
| Concentrates | 4.1% | $24 | 1242.7% |
State Rank Table
| State | Flower | Pre-Roll | Vapor Pens | Concentrates | Edibles | Oral | Other |
|---|---|---|---|---|---|---|---|
| Manitoba | 15 | ⊖ | ⊖ | ⊖ | ⊖ | 12 | ⊖ |
| Saskatchewan | 10 | 22 | ⊖ | 27 | ⊖ | ⊖ | ⊖ |
| Alberta | 17 | 41 | 48 | 29 | ⊖ | ⊖ | ⊖ |
Canadian Cannabis's sales are concentrated in Alberta (about 61% of brand sales), with secondary presence in Saskatchewan and Manitoba.
| State | Flower | Pre-Roll | Vapor Pens | Concentrates | Edibles | Oral | Other |
|---|---|---|---|---|---|---|---|
| 10 | 22 | ⊖ | 27 | ⊖ | ⊖ | ⊖ | |
Unlock The Full Table
Log in to unlock the full state rank table and compare every category row for this brand.
Market Position
Competitive summary unavailable.
SKU View
Top products for Oct 2026 with sales and momentum indicators.
| Product | Category | MoM |
|---|---|---|
#2  | Flower | 35.3% |
#4  | Flower | 0.1% |
#6  | Flower | 24.5% |
#8  | Pre-Rolls | 130.8% |
#10  | Concentrates | 40.8% |
Unlock The Full Table
Log in to unlock the full top selling products table and export the share image for this section.
Benchmarking
Peer brands benchmarked against Canadian Cannabis using competitive landscape rank coverage, proximity, and momentum.


