

Top States
Far Out Crops Top StatesSep 2026
Top states where Far Out Crops is active based on indexed sales coverage.
Is this your Brand? Log in to Hoodie!
Sep 2026
FAR OUT CROPS is grappling with a dramatic 44.1% YoY decline in sales, dropping from #116 to #133 in Ontario. Despite this, a recent 8.1% uptick in sales over the last three months hints at a potential pivot towards higher volume at lower price points.
Categories
Top States
Top states where Far Out Crops is active based on indexed sales coverage.
Trend View
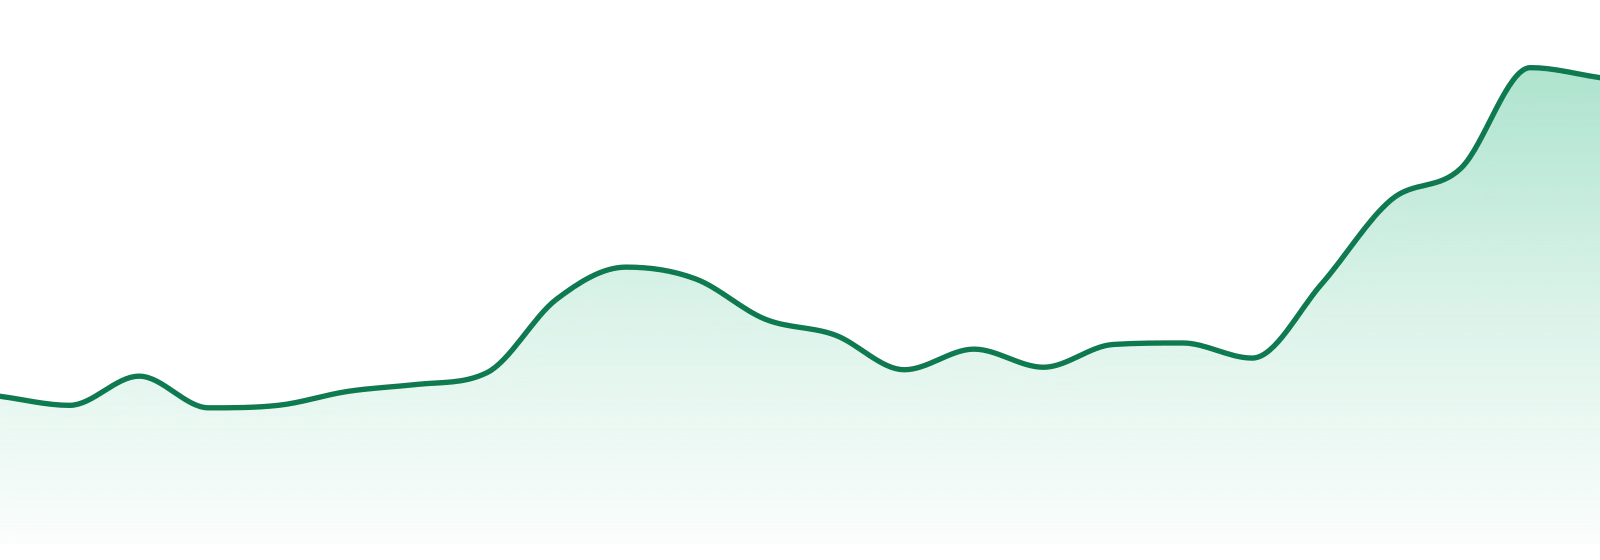
24-Month Trend

Average Price
$37.71
YoY Sales Trend
107.3%
2Y Sales Trend
422.2%
Pre-Rolls lead at 52.6% of sales but have seen a 44.8% YoY decline, making it the slowest category. Flower holds 47.4% but also suffers with a 43.3% YoY drop, reflecting a challenging environment for both categories.
| Category | Sales Share | Avg Price | YoY |
|---|---|---|---|
| Pre-Rolls | 22.8% | $25.8 | 2.6% |
Unlock The Full Table
Log in to unlock the full category breakout table and image export actions for this brand.
Trend View
24-Month Trend
Average Price
$37.71
YoY Sales Trend
107.3%
2Y Sales Trend
422.2%
Category Breakout
| Category | Sales Share | Avg Price | YoY |
|---|---|---|---|
| Flower | 77.2% | $43.66 | 197.8% |
| Pre-Rolls | 22.8% | $25.8 | 2.6% |
State Rank Table
| State | Flower | Pre-Roll | Accessories | Other |
|---|---|---|---|---|
| Manitoba | 24 | ⊖ | ⊖ | ⊖ |
| Alberta | 16 | ⊖ | ⊖ | 49 |
| Saskatchewan | 36 | 46 | ⊖ | ⊖ |
FAR OUT CROPS is concentrated solely in Ontario, which accounts for 100% of its sales. This geographic focus intensifies competition within the province.
| State | Flower | Pre-Roll | Accessories | Other |
|---|---|---|---|---|
| 16 | ⊖ | ⊖ | 49 | |
Unlock The Full Table
Log in to unlock the full state rank table and compare every category row for this brand.
Market Position
FAR OUT CROPS ranks #133 in the Pre-Rolls category, trailing leaders like GENERAL ADMISSION and BACK FORTY by 132 and 131 spots respectively. The brand has lost ground over the past year, slipping from #116 to #133.
SKU View
Top products for Sep 2026 with sales and momentum indicators.
| Product | Category | MoM |
|---|---|---|
#2  | Flower | 38.2% |
#4  | Flower | 25.7% |
#6  | Pre-Rolls | 42.3% |
#8  | Flower | 39.5% |
Unlock The Full Table
Log in to unlock the full top selling products table and export the share image for this section.
Benchmarking
Peer brands benchmarked against Far Out Crops using competitive landscape rank coverage, proximity, and momentum.


