
Top States
 Vibations Top StatesSep 2026
Top states where Vibations is active based on indexed sales coverage.
Is this your Brand? Log in to Hoodie!
Sep 2026
Hydrate. Motivate. Vibe. Focus and energize your day with Vibations: Advanced Hydration. Our great tasting cannabis + electrolyte drink mix is infused with fast-acting, full-spectrum cannabis, optimized cannabinoids, and natural ingredients so you can vibe your way to your best d...
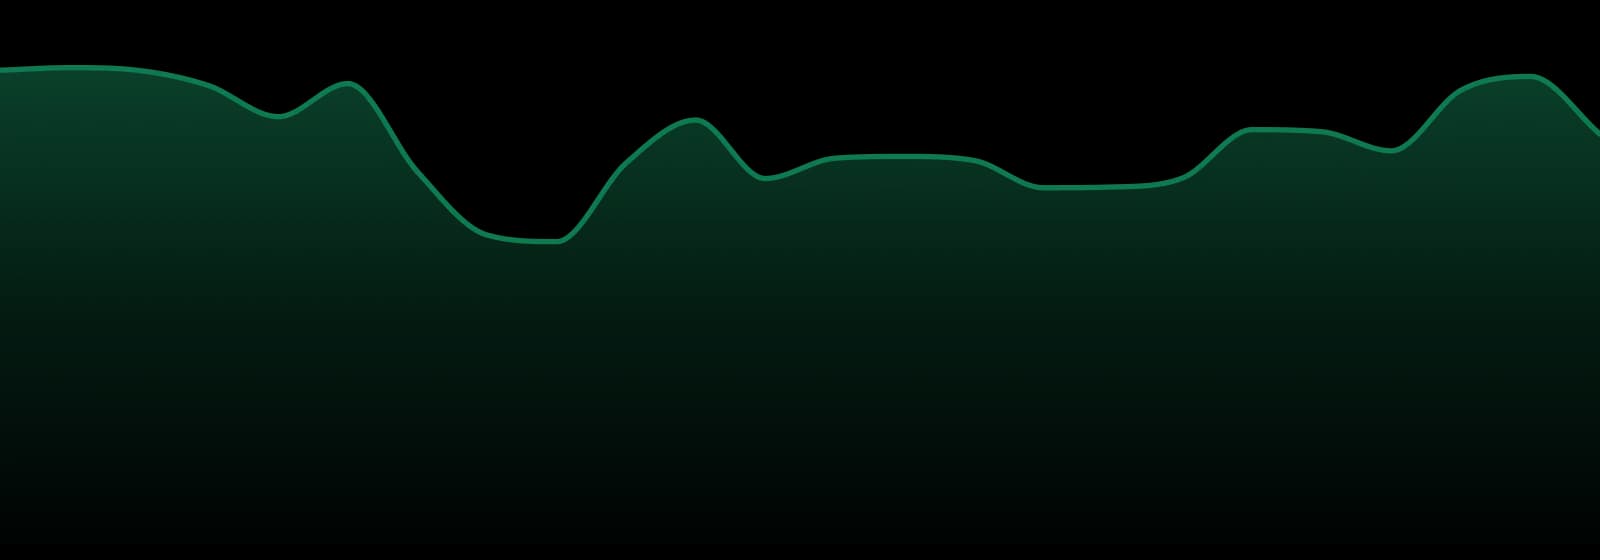
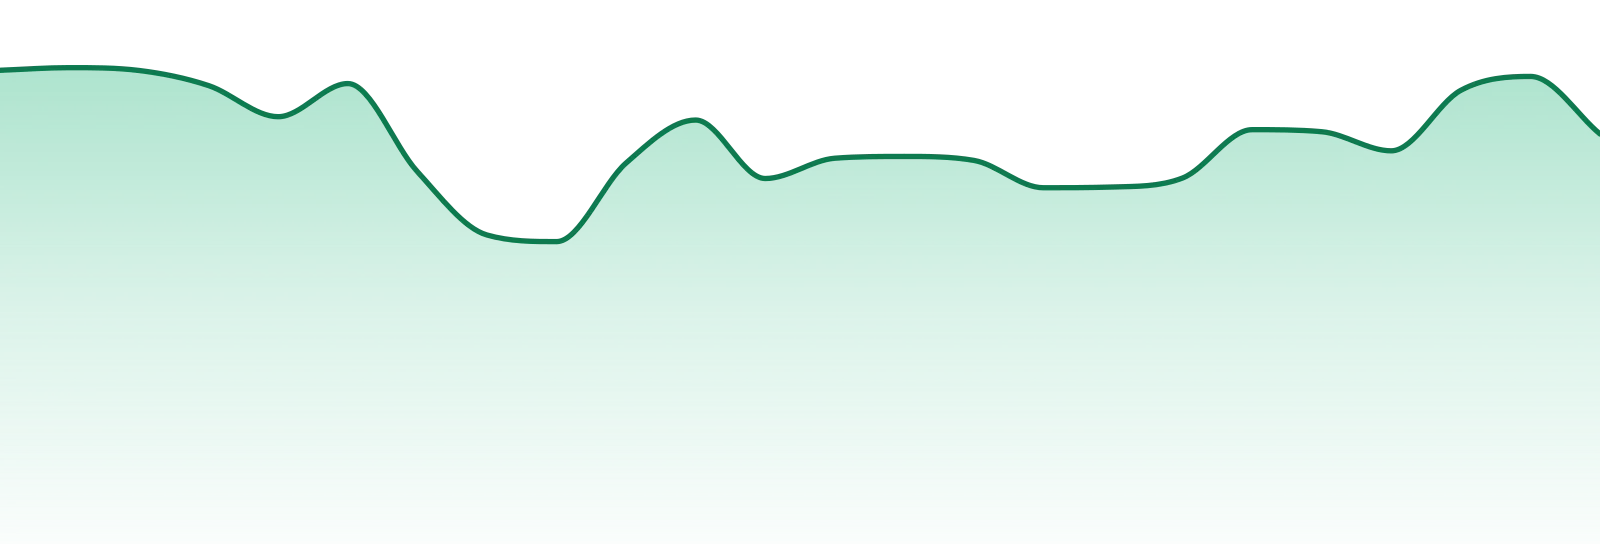
VIBATIONS achieved an impressive 18.0% YoY growth, with a notable 18.9% surge over the last three months. Mid-tier positioning reflects strategic pricing adjustments as consumer preferences evolve.
Categories
Top States
Vibations Top StatesSep 2026Top states where Vibations is active based on indexed sales coverage.
Trend View
Market Insights SnapshotSep 202624-Month Trend
Average Price
$17.21
YoY Sales Trend
12.2%
2Y Sales Trend
14.7%
Edibles dominate VIBATIONS' portfolio, capturing 99.5% of sales with a remarkable 17.4% increase YoY. This segment remains the fastest-growing in the market.
| Category | Sales Share | Avg Price | YoY |
|---|---|---|---|
Unlock The Full Table
Log in to unlock the full category breakout table and image export actions for this brand.
Trend View
Market Insights SnapshotSep 202624-Month Trend
Average Price
$17.21
YoY Sales Trend
12.2%
2Y Sales Trend
14.7%
Category Breakout
| Category | Sales Share | Avg Price | YoY |
|---|---|---|---|
| Edibles | 100.0% | $17.18 | 11.7% |
State Rank Table
| State | Edibles | Accessories | Pre-Roll |
|---|---|---|---|
| Maryland | 19 | ⊖ | ⊖ |
| Illinois | 40 | ⊖ | ⊖ |
VIBATIONS is concentrated in Maryland (47.7%), Illinois (30.6%), and Massachusetts (21.7%). This geographic footprint highlights its presence in key cannabis markets.
| State | Edibles | Accessories | Pre-Roll |
|---|---|---|---|
| 40 | ⊖ | ⊖ |
Unlock The Full Table
Log in to unlock the full state rank table and compare every category row for this brand.
Market Position
Competitive LandscapeSep 2026Ranked #21 among competitors in the Edibles category, VIBATIONS has improved from #25 over the past year. It faces strong competition from BETTY'S EDDIES, INCREDIBLES, and CURIO WELLNESS.
SKU View
Top Selling ProductsSep 2026Top products for Sep 2026 with sales and momentum indicators.
| Product | Category | MoM |
|---|---|---|
#2  | Edibles | 14.0% |
#4  | Edibles | 19.9% |
#6  | Edibles | 5.0% |
#8  | Edibles | 14.3% |
#10  | Edibles | 5.3% |
Unlock The Full Table
Log in to unlock the full top selling products table and export the share image for this section.
Benchmarking
Peer brands benchmarked against Vibations using competitive landscape rank coverage, proximity, and momentum.


