
Top States
 Bits Top StatesSep 2026
Top states where Bits is active based on indexed sales coverage.
Is this your Brand? Log in to Hoodie!
Sep 2026
Bits are the accessible edible that encourages doing – without overdoing it. Five delicious flavors formulated with cannabinoids & a dash of adaptogens to add just a little bit more to all of life’s activities.
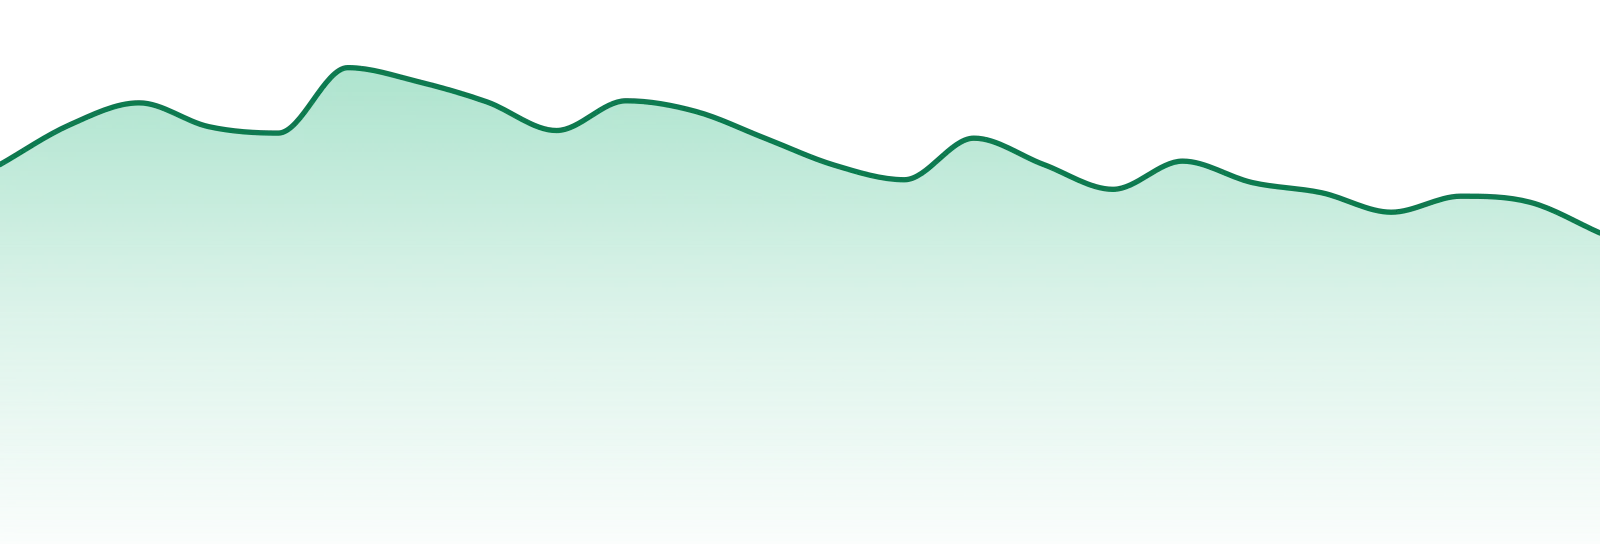
BITS' performance declined sharply, with a 26.4% drop in year-over-year growth. The brand's rank slipped from #10 to #13, reflecting increasing competitive pressure in Florida's mid-tier edibles market. A 9.1% decline over the last three months underscores ongoing challenges.
Categories
Top States
Bits Top StatesSep 2026Top states where Bits is active based on indexed sales coverage.
Trend View
Market Insights SnapshotSep 202624-Month Trend

Average Price
$15.1
YoY Sales Trend
23.3%
2Y Sales Trend
15.1%
Edibles dominate BITS' portfolio at 100%, yet the category faced a 26.3% YoY decline, indicating a tough market for all players. This slowdown positions BITS in a challenging landscape, where growth is elusive.
| Category | Sales Share | Avg Price | YoY |
|---|---|---|---|
Unlock The Full Table
Log in to unlock the full category breakout table and image export actions for this brand.
Trend View
Market Insights SnapshotSep 202624-Month Trend
Average Price
$15.1
YoY Sales Trend
23.3%
2Y Sales Trend
15.1%
Category Breakout
| Category | Sales Share | Avg Price | YoY |
|---|---|---|---|
| Edibles | 100.0% | $15.06 | 23.4% |
State Rank Table
| State | Edibles | Accessories | Oral |
|---|---|---|---|
| Florida | 10 | ⊖ | ⊖ |
| Connecticut | 14 | ⊖ | ⊖ |
| New Jersey | 19 | ⊖ | ⊖ |
| Maryland | 20 | ⊖ | ⊖ |
| Pennsylvania | 17 | ⊖ | 28 |
BITS has a solid presence in Florida (24.0%) and New Jersey (22.7%), contributing to its activity across 8 states. This concentration highlights the brand's strategic focus on key markets.
| State | Edibles | Accessories | Oral |
|---|---|---|---|
| 14 | ⊖ | ⊖ | |
| 20 | ⊖ | ⊖ | |
Unlock The Full Table
Log in to unlock the full state rank table and compare every category row for this brand.
Market Position
Competitive LandscapeSep 2026Competitive summary unavailable.
SKU View
Top Selling ProductsSep 2026Top products for Sep 2026 with sales and momentum indicators.
| Product | Category | MoM |
|---|---|---|
#2  | Edibles | 10.1% |
#4  | Edibles | 13.0% |
#6  | Edibles | 5.7% |
#8  | Edibles | 6.4% |
#10  | Edibles | 4.2% |
Unlock The Full Table
Log in to unlock the full top selling products table and export the share image for this section.
Benchmarking
Peer brands benchmarked against Bits using competitive landscape rank coverage, proximity, and momentum.


